1 in 4 registered voters disliked candidates, campaign issues, skipped election - Pew survey
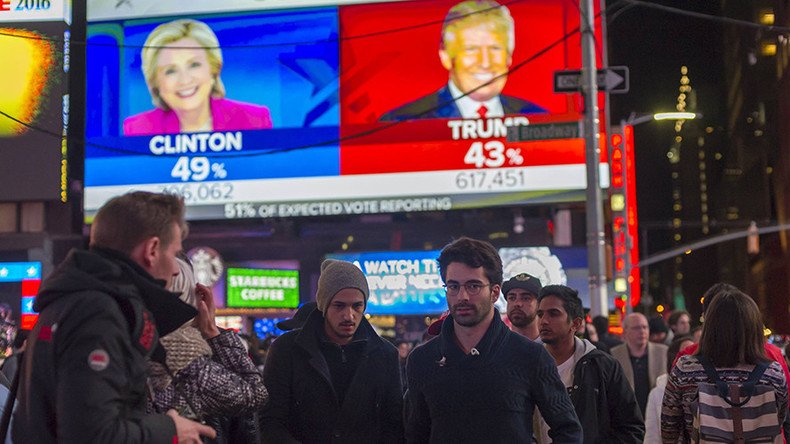
Tens of millions of registered voters in the US didn’t vote because of dissatisfaction with the candidates or campaign issues, according to a new report. The dissatisfaction, expressed by 25 percent of voters, had grown from the last presidential election.
The analysis by Pew Research Center showed the 2016 election stood out because the racial and ethnic diversity of voters “did not grow for the first time since the 90s, despite an eligible voting population that was the most racially and ethnically diverse ever.”
“In 2016, minorities made up a third (34 percent) of all non-voters, up from a quarter in 2012,” stated Pew in its analysis of new Census Bureau data.
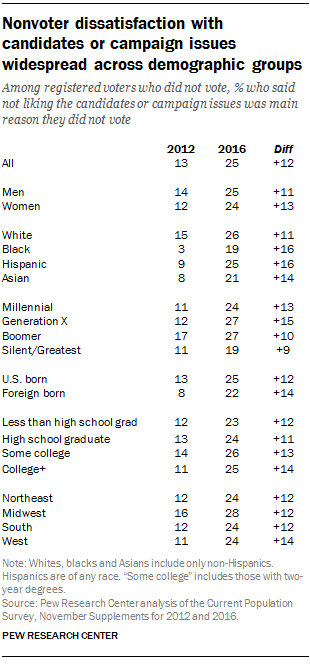
Dislike of the candidate or campaign issues extended across all major demographic groups, the report showed. Among black voters, 19 percent said that was the reason for not voting, up from just 3 percent in 2012, when President Barack Obama was on the ballot. The share was equal among those black non-voters not being interested or thinking their vote would not make a difference.
For Latino voters, 25 percent said there were problems with the candidate or the issues, a growth of 9 percent from 2012, and Asian and White voters dissent had grown 14 percent and 11 percent, respectively, in 2012.
“When looking at generational differences, nonvoters in all generations were more likely to cite dislike of candidates than in past years. About three in 10 of both Generation X (27 percent) and Baby Boom (27 percent) registered voters who did not vote in 2016 cited ‘not liking the candidates or campaign issues’ as their main reason for not participating in the election,” wrote Gustavo Lopez, a researcher at Pew.
Analysis also showed that nearly a quarter of millennials (24 percent) and about two in 10 of those in the Silent/Greatest generation (19 percent) said the same.
While disliking the candidate or the issues was the most frequently cited reason for not voting, other top reasons included a lack of interest or a feeling that their vote wouldn’t make a difference at 15 percent, while 14 percent said they were too busy or had a conflicting schedule.
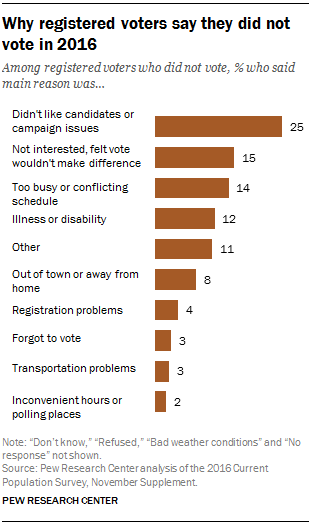
Other reasons were having an illness or disability at 12 percent, being out of town or away from home at 8 percent, other reasons at 11 percent, while 3 percent forgot to vote.
“In pre-election polling last year, registered voters expressed far lower levels of satisfaction with their choices of candidates than in prior elections over the past several decades,” Lopez wrote.