How big data put smaller towns on the global culture map
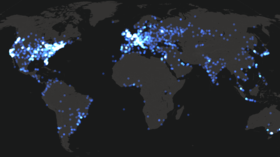
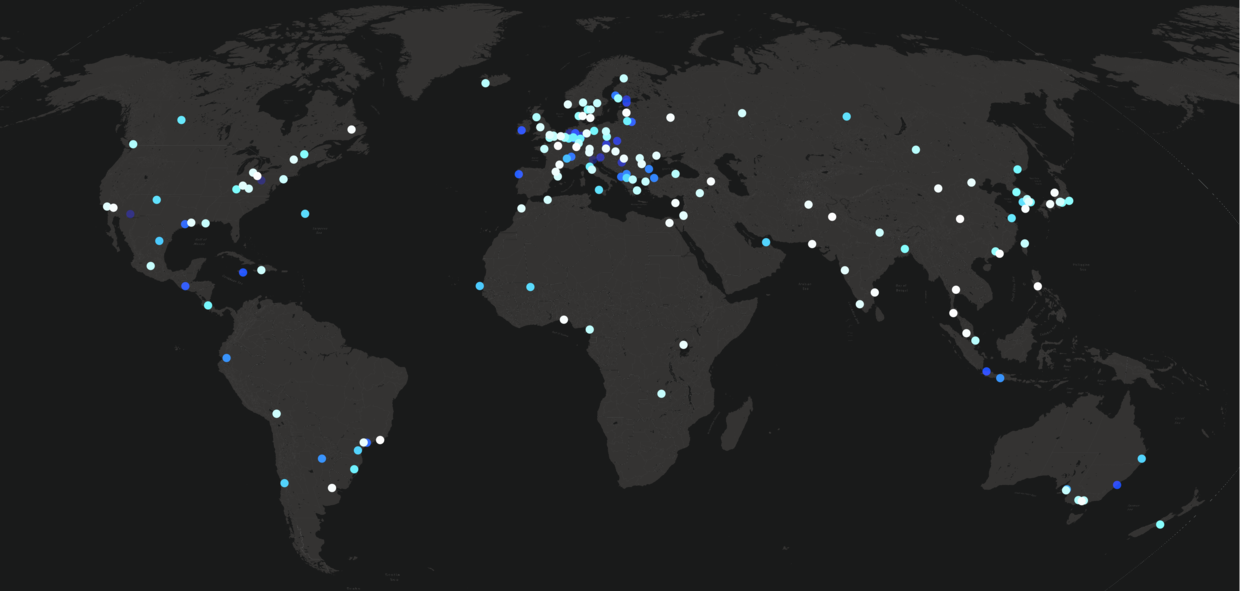
If you place all 6 million cultural events that have been published since mid-2000s on global platforms like Meetup, you may think that global cultural events are concentrated in larger cities like New York, London, or Moscow.
This was true before, but the last decade has shown some surprising new trends... that have gone unnoticed.
Not only are there more smaller cities visible on the global cultural map than ever before, but we see more and more cultural events happening outside of the traditional world cultural centers.
So what else can we learn about contemporary global culture with the help of big data?
A map nobody drew up before
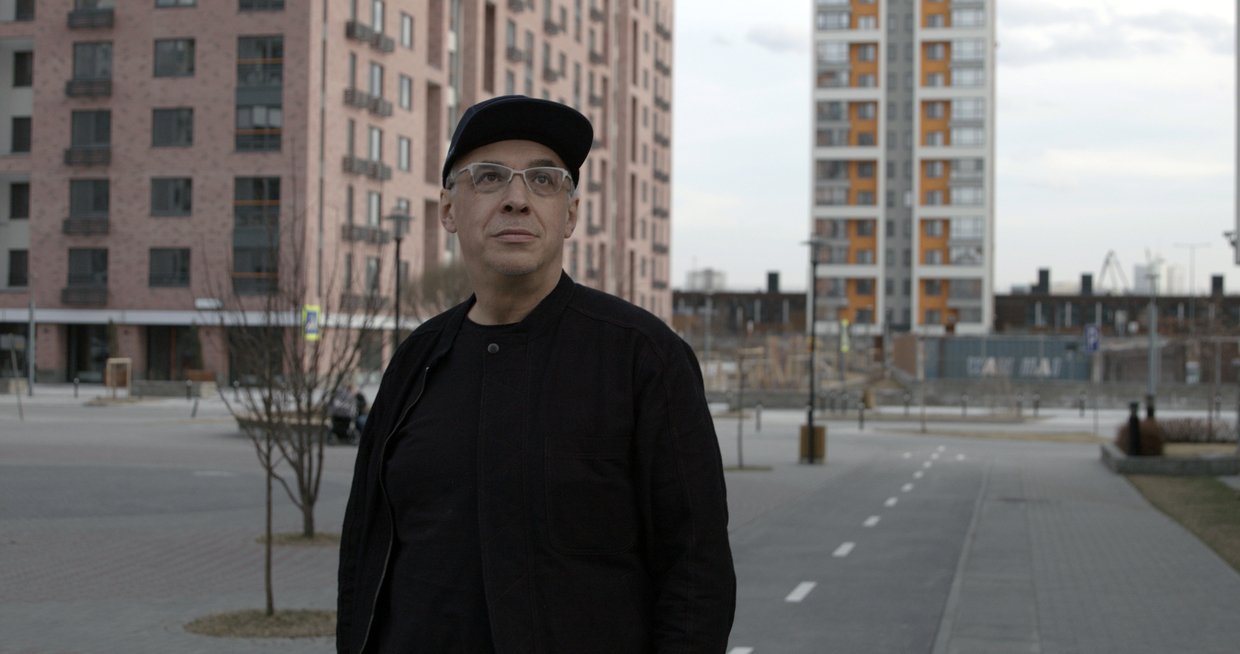
Lev Manovich, director of ‘Elsewhere’ – a big data project for the University of Tyumen – is a pioneer in using computational methods to study contemporary culture.
He has been developing tools to analyse and visualise massive cultural datasets in humanities since the middle of the 2000s.
“I think, originally, the idea came to me in 2005. So it took almost 15 years to get ready to do this,” Manovich told Russia Beyond.
‘Elsewhere’ is the first project of the Cultural Trends Lab that was opened in the University of Tyumen in 2018 to tackle something nobody has done before.
According to Manovich, the idea of the project is to “collect various public data, to put it together and to use techniques for AI and data science” to make maps showing “how contemporary culture has grown up since the end of the Cold War in the past 30 years.”
The main motivation of the the ‘Elsewhere’ project is our lack of real understanding of how contemporary culture is spreading across the world.
“How many film festivals in the world? How many creative clusters, theatres, exhibitions, designers - nobody knows,” Manovich says.
A disproportionate amount of attention
One of the reasons why our understanding of global culture is limited is because a small number of world capitals have always been getting a disproportionate amount of attention.
“It's all about Moscow, New York and Beijing, so what about Ufa, Tyumen? What about approximately 4,000 cities in the world that have between 150 thousand and 1 million people?” Manovich asks.
In the mid-2000s, the rise of global platforms for organizing cultural events such as Behance, Meetup, TED and others, made those smaller cities globally visible for the first time in their history.
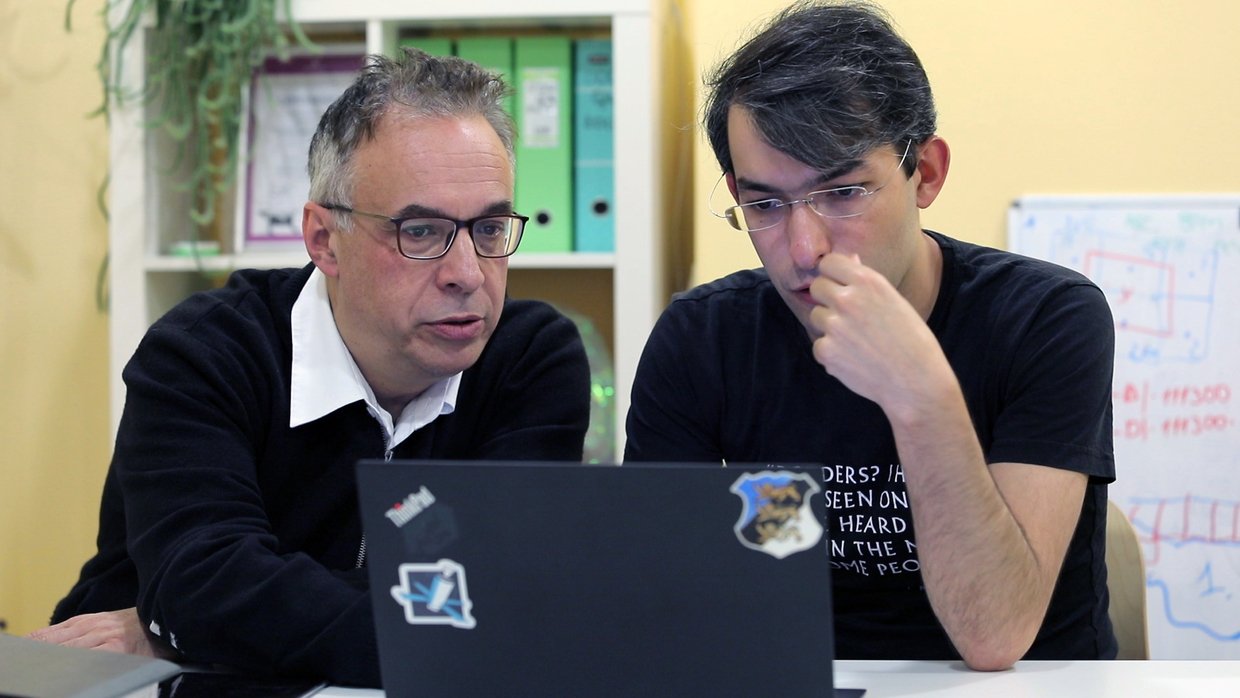
Ruslan Dokhov, R&D Lead at Habidatum company, working with Lev Manovich on the project, says that the rise of such platforms has “led to the beginning of cultural globalization developing not in isolation, but globally, up front.”
By the end of the 2010s, such platforms spread across the planet and the numbers of events announced on them became big enough to be analyzed.
According to Manovich, for 'Elsewhere', they “extracted all the names, all the cities from a unique dataset of millions of events the team compiled for the project, which has 6 million events, starting around 2007.”
How can one unify the data?
How does one analyse 6 million events appearing on platforms that are different in size, structure, language and geography?
Until now, cultural analytics projects directed by Manovich has been using single sources of data. The big new challenge of the 'Elsewhere' project is how to analyze data from many sources simultaneously. The popularity of the platforms varies from country to country, and this presents another challenge - none of them is fully global.
“As a rule, cultural analytics focuses on one single source. For example, it can be Instagram, it can be an event site or some particular type of event. But even this poses huge difficulties in terms of collecting data and transforming it into some comprehensible form,” Ruslan Dokhov says.
For the Elsewhere project, Manovich came up with a solution to analyse dissimilar data. He suggested analyzing both data structured by platforms and unstructured data - text descriptions of events published by their organizers.
“Data about their events published by cultural institutions such as museums, galleries, theatres online, is structured. You have dates and locations. But we also have texts. Every theater play is described. So is every art exhibition. These descriptions range in length from a few sentences to a few paragraphs,” Manovich says.
First 'Elsewhere' results
Despite the fact that 'Elsewhere' has just begun analysing data, the early analysis has already given some interesting results.
First, there are good reasons to rethink the global role of biennales. This is a great example of an event that becomes trendsetting.
The first international art biennale took place in Venice in 1895. By the year 1990, there had been just 37 international biennales in various countries; however, already 74 by the year 2000, 127 by 2010, and 200 by 2018.
The biennale geography spread dramatically, outpacing the rise of global platforms, which means that these are the events that, more than others, push global culture forward.
Secondly, the team uncovered some countries that are more culturally globalised than their neighbours.
“Like South Africa and Kenya. Or Kazakhstan, which is growing very fast. The number of events there is growing at an incredible pace and it radically stands or in the entire Central Asia region,” Dokhov says.
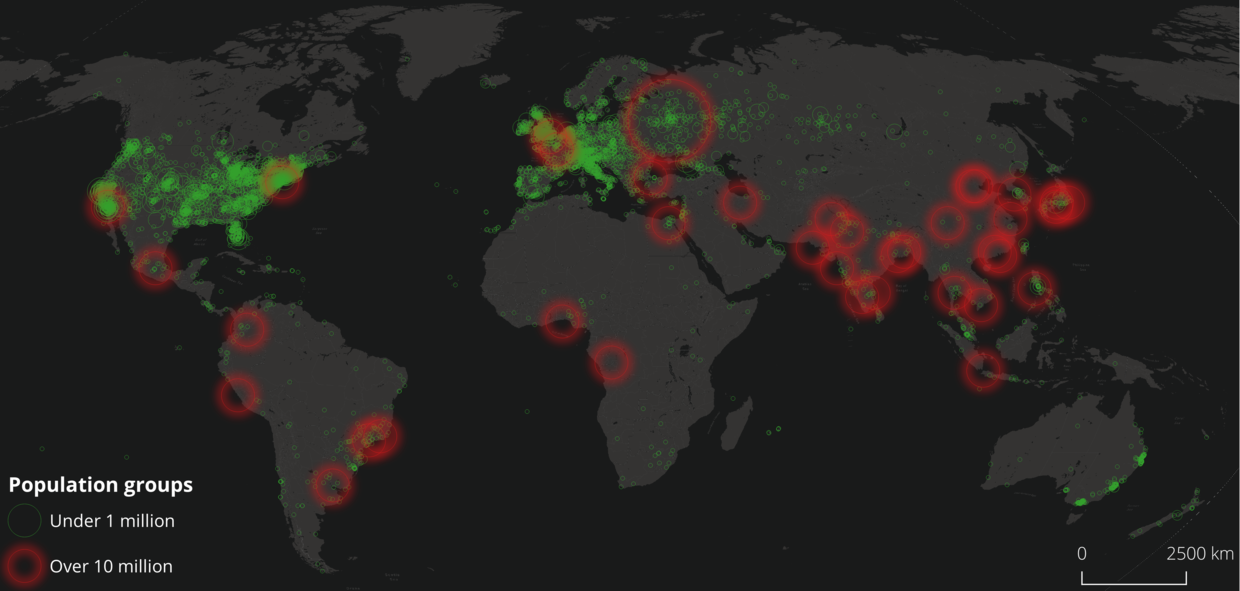
The third interesting discovery is that since 2012-13, there has been a dramatic rise of cities with a population of less than 1 million people popping up on the culture map constructed by the project.
The share of these small towns has increased multiple times. It has grown from 10% to at least 30%.
Not only are there more events, some cities, regions and even countries can already be seen specialising in certain types of events.
How can ‘Elsewhere’ results be used?
Thus, big data helps uncover trends that cannot be seen otherwise. It can be likened to drawing the first geographic maps of the World.
“When we place all these events on a map, when we place certain types of events on a map, stating the exact year, creating a dynamic map, we basically see a picture that no one has ever seen before,” Ruslan Dokhov says.
The tools and technology of analysis used by 'Elsewhere' can afterwards be applied to other languages and platforms.
One of the many practical sides of using data is to create tools that could help local cultural projects, groups, creators and areas to improve their global visibility.
And in doing so, to provide them with the tools that they can use to compare themselves with their counterparts in other countries without risking repetition.
Gleb Fedorov, Russia Beyond